By Billy Thomas and Lydia Boss, special contributor
Artist Trust is a nonprofit dedicated to helping Washington State artists of all disciplines thrive. Its mission is to support and encourage artists working in all disciplines to enrich community life throughout Washington State.
Founded in 1986, it was formed by a group of artists and arts lovers who came together to create support for art at its source—the artist. Since then, Artist Trust has invested over $11 million in Washington State artists through funding, trainings, and resources and has provided programs that meet the changing needs of artists.
The organization approaches its work through a lens of racial equity and helps artists establish and maintain careers through direct support, connections, and advocacy.
Lydia Boss, Artist Trust program manager, said the survey “was first launched in 2016 to allow us to better understand the artists we serve and share information from responding artists with other artist-serving organizations.” Although new to the organization, having started last January, Boss says she is proud of the traction that the survey has gained. “Over the past three years, Artist Trust has implemented programing, facilitated community-wide conversations, and worked directly with artists and arts organizations to respond to the information gathered from our Annual Survey.”
2018 Artist Trust Survey
During the summer of 2018, over 1,800 artists from across Washington State participated in the Artist Trust Annual Survey. Results of this annual survey allow us to better understand the artists we serve and share information from responding artists with other artist-serving organizations. With greater knowledge about the needs of artists around the state, we can all work to provide better support and further elevate the voices of Washington’s artists.
Respondents to the 2016 & 2017 Annual Artist Surveys indicated a high need for trainings on promoting their work and building audience, in addition to topics like pursuing opportunities and business management. In 2018, respondents expressed the same needs and were given the opportunity to provide more personal context through open response fields.
The following are highlights from Artist Trust’s 2018 Annual Artist Survey, followed by an in-depth analysis of the data.
- 61% of responding artists identify as visual artists, and many respondents indicate that they work in more than one discipline.
- 36% of respondents to the 2018 Annual Artist Survey are between 35 and 54 years old and 71% identify as female.
- In our study, race and ethnicity self-identification categories are non-exclusive, meaning that respondents could select multiple options, including an open response option associated with the Other category. In 2018, 38% of survey respondents identify as at least one race other than White/European and 76% identify exclusively or include White/European in their racial identity.
- Almost ¾ of 2018 respondents reside in Puget Sound, with 54% of them living in King County. Outside of Puget Sound, the highest response rate (11%) was from artists living in other counties in the West.
- In 2018, 25% of respondents report making at least half of their annual income from their art practice and related activities and almost 4/5 (79%) indicate that they have had public presentations of their work in Washington State in the last 12 months.
- 21% of respondents indicate receiving local, regional, national, or international funding for their art in 2018.
- The biggest reported challenges responding artists in Washington face are around marketing and building an audience for their work, with 2/3 or more of all respondents ranking those concerns as Somewhat or Very Challenging.
- 25% of responding artists feel that artists are supported where they live, with another 55% indicating that artists are “Somewhat” supported where they live.
- When asked what they need to thrive as an artist, respondents shared perspectives about money, community, space, and time.
Background and Methodology
In summer 2015, Artist Trust launched a preliminary survey to explore artists’ needs. This survey proved instrumental to building responsive support mechanisms for artists, and in 2016 the Annual Artist Survey was launched as a new initiative to collect data from artists across Washington State. Continuing in 2017 and now 2018, the Annual Artist Survey serves as a yearly research process that gathers information and feedback from artists around the state.
The Annual Artist Survey comprises two intermingled sections: Core Questions and Timely Issues Questions. The set of Core Questions remains the same each year, providing the opportunity to develop an evolving understanding of Washington State’s artists. The Timely Issues Questions change each year and allow us to collect data on the issues that impact artists most each year as well as request feedback on Artist Trust programming, which evolves over time in response to the annual survey and changes in our field, both locally and nationally.
All self-identified artists in Washington State were welcome to participate in the 2018 Annual Artist Survey [1]. Multiple efforts were made to reach as many artists as possible, including utilizing email distribution lists of over 16,000 individual artists, direct promotion to program participants and grant applicants, and by sharing the survey with more than 200 organizational partners around the state and inviting them to share with artists in their networks.
Analysis
What is your artistic discipline? (Select all that apply.)
In 2018, 61% of responding artists identify as visual artists and many artists indicate that they work in more than one discipline.
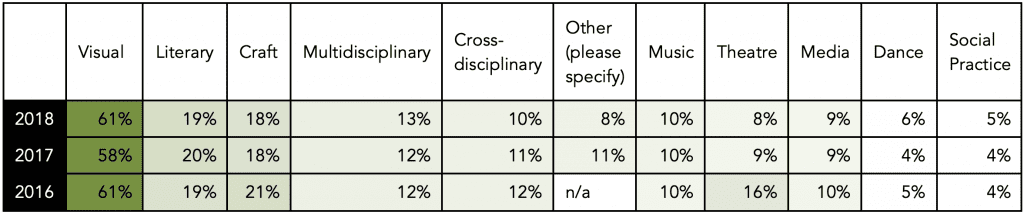
Artists were able to select more than one answer to this question, leading to a total of 3,002 responses from the 1,801 respondents. Of these responses, 1,098 (61%) of the responses were for visual art, which is nearly consistent with previous years’ results (58% in 2017 and 61% in 2016).
The amount of responses received compared to the number of responses shows the continued emergence and prevalence of artists working across and within multiple disciplines (see also the 23% of respondents who selected Multidisciplinary and Cross-disciplinary as one of their responses).
The average amount of disciplines selected by each respondent was just under seven out of a total of eleven options.
What is your age?
60% of respondents to the 2018 Annual Artist Survey are between 45 and 74 years old.
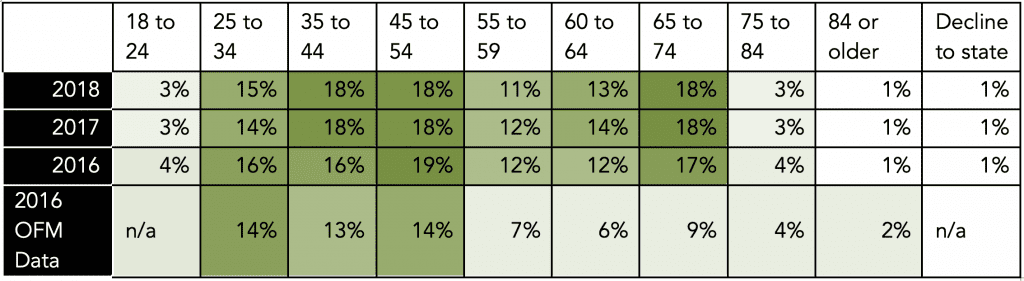
Per the above demographic note, the Annual Survey data on age skews older than 2016 population data from Washington’s Office of Financial Management data[2].
Year-over-year, 2018, 2017, and 2016 age data collected in the Annual Artist Survey remains relatively consistent, with almost ⅔ of respondents between 45 and 74 years old.
What is your gender?
Over 2/3 of responding artists identify as female.
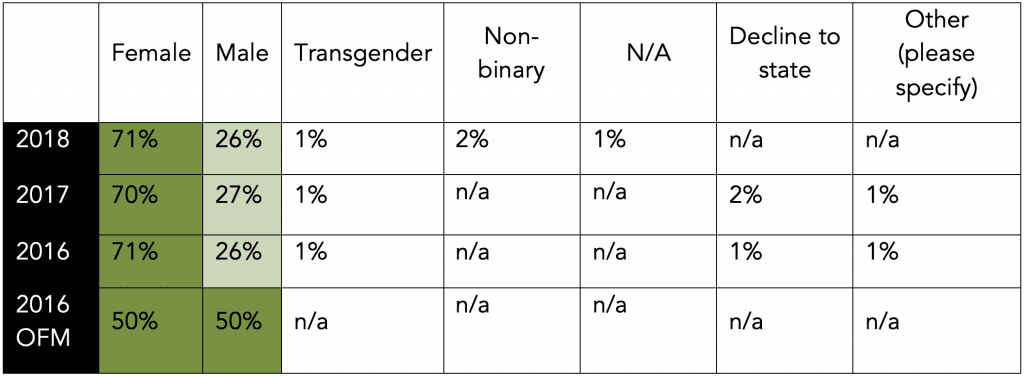
In the 2018 survey, this question was presented as open-ended, unlike in previous years. These open-ended responses were then tagged with one of five tags: Female, Male, Transgender, Non-binary, N/A.
The responses stayed consistent with 2017 and 2016 results, even with the change in question format.
How do you define your race and ethnicity? (Select all that apply.)
In 2018, 76.4% of survey respondents identify as White/European and 39% selected other racial/ethnic identities. These categories are non-exclusive, meaning that respondents could select multiple options, including an open response opportunity associated with the Other option.
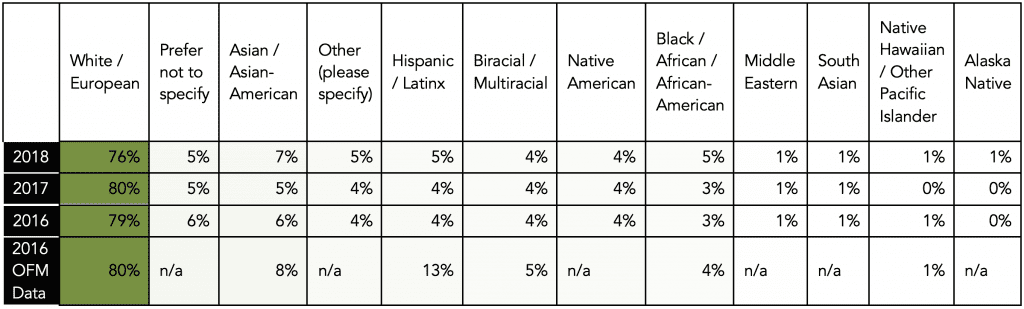
For this question, respondents were able to select multiple options and were also able to select “Other” and input an open answer. There were 2,047 responses from the 1,801 respondents, indicating that quite a few people selected more than one racial and/or ethnic identification in this survey.
In 2017 and 2016, the percentage of respondents indicating non-white/European identities was consistent around 30%, whereas POC respondents comprised nearly 40% of this year’s survey responses.
The highest response was from white artists (76%), while all other racial & ethnic categories represented 39% of the responses.
Although these numbers look consistent with comparable data from Washington’s Office of Financial Management, we aren’t able to do apples-to-apples comparisons, as some categories are different and you can only indicate one race/ethnicity in the state reporting, while our data allows for multiple selections.
To see how data collected about race and ethnicity are implemented in the programming and operations at Artist Trust, please refer to its Racial Equity Framework at artisttrust.org.
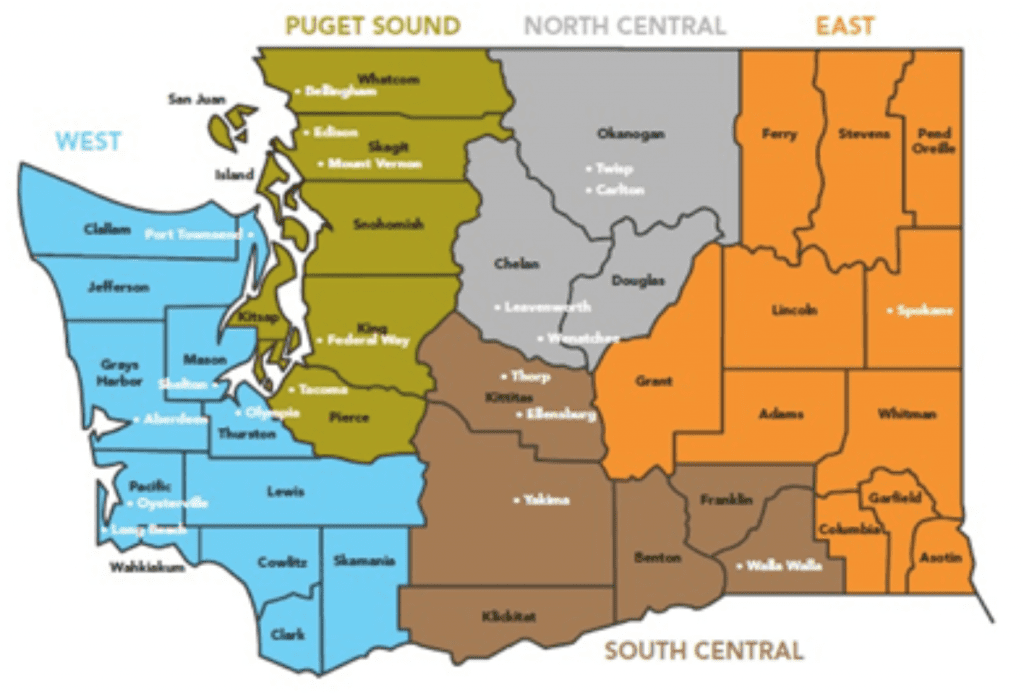
What Washington State county do you live in?
(This data is broken into AT-designated regions as pictured below the chart)
Almost 3/4 of 2018 respondents reside in Puget Sound, with 54% of them living in King County. Outside of Puget Sound, the highest response rate (11%) was from other counties in the West region.
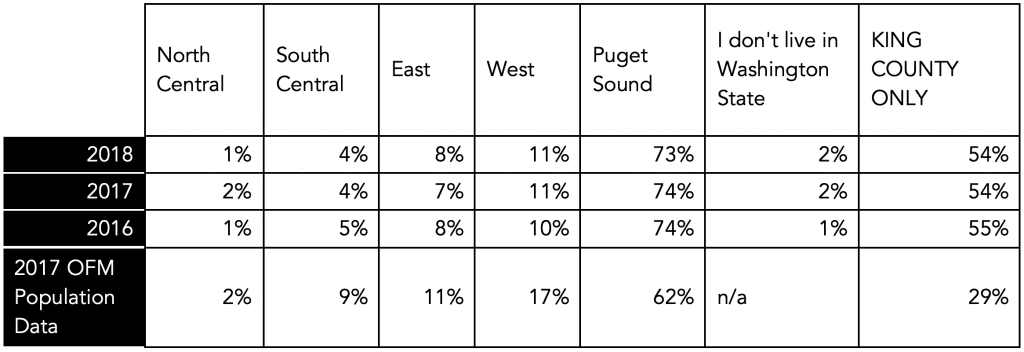
We saw an increase in responses from the East region of the state. Since 2015, we have had a stronger presence in the Spokane area and believe the increase in responses from the East to be a result of that program. Otherwise, our regional data has remained essentially consistent over time.
We have a higher response rate in Puget Sound, King County in particular, than what is reflected in OFM population data. We attribute this to a higher density of artists living in these urban areas and the fact that the organization’s main office is based in Seattle.
Do you live in a rural, suburban, or urban area?
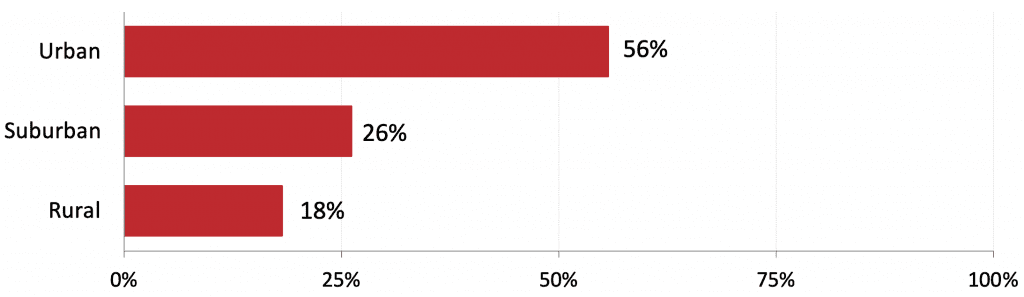
Per our strategic plan priorities, we have been looking at the differences between artists in rural, urban, and suburban areas. We added this question to the core in 2017 with the intention of using the data to inform program content and strategy when working in support of rural artists in the coming years.
This year, just over half of responses came from artists working in urban communities. The 18% of rural-identifying artists is slightly higher than in 2017. In future planning, we will parse this data by county and region to better understand the breakdown as it pertains to our programming and engagement plans.
In the last 12 months, which of the following best reflects your art income and related grants, teaching, and activities? [3]
In 2018, 26% of respondents report making at least half of their annual income from their art practice and related activities.
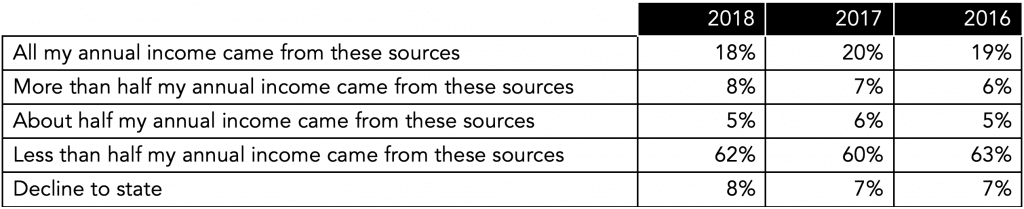
Most respondents (62%, up from 60% in 2017) make less than half of their annual income from their artistic practice, with only 18% making all of their annual income from art (down from 20% in 2017). Overall, there was a decrease in reported income from art-related activities across the board.
Further analysis shows the most lucrative disciplines (i.e. the disciplines in which respondents claimed to earn all of their income from their artistic work) remain consistent year-over-year: social practice, music, and dance. The least lucrative disciplines based on this data are literary, craft, and visual art which is, again, consistent with last year’s dataset.
In the last 12 months, has your artistic work been publicly presented in any way? This can include, but is not limited to, exhibitions, readings, publications, viewing or listening parties, shows, presentations, performances. (Select all that apply.)
Almost 4/5 of respondents (79%) indicate that they have had public presentations of their work in Washington State in the last 12 months.
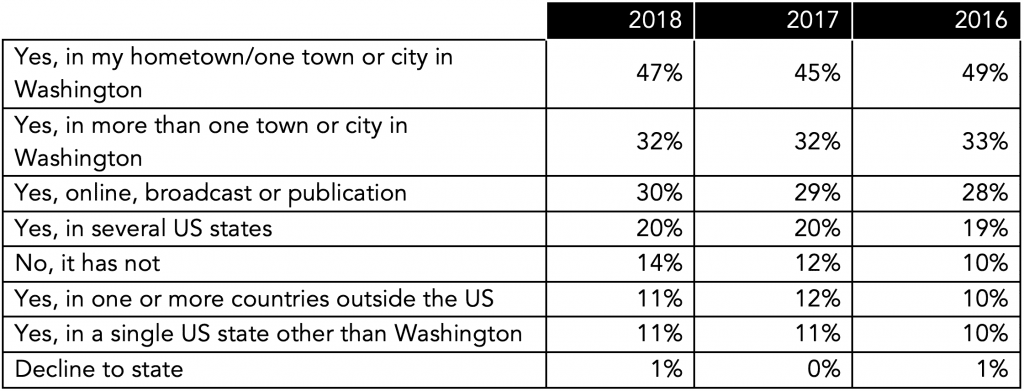
The percentage of artists showing their work in Washington increased more than 2% from the 2017 data. The other increase we see here is a rise in artists who have not had public presentations of their work in the past year, which went from 12% in 2017 to 14% in 2018.
In the last 12 months have you received grant support or other funding for your artistic work? (Select all that apply.)
22% of respondents indicate receiving some local, regional, national, or international funding for their art in 2018.
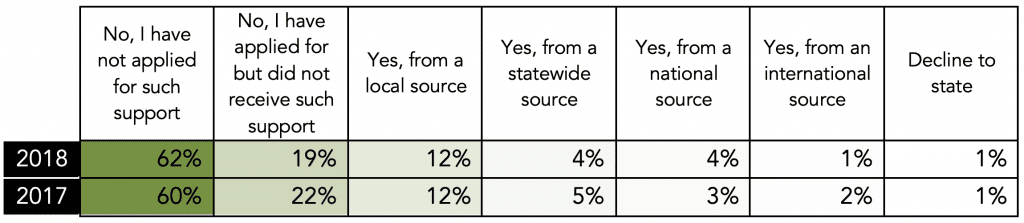
62% of respondents indicate not having applied for such funding in the past year, while almost a fifth (19%) have applied and not received support. This percentage has fallen over three percent in the past year, which indicates both a decrease in artists applying for support as well as an increase in successful applications.
Note: the wording of this core question changed for clarity between the 2016 and 2017 surveys, so it does not have direct comparison data from last year’s survey.
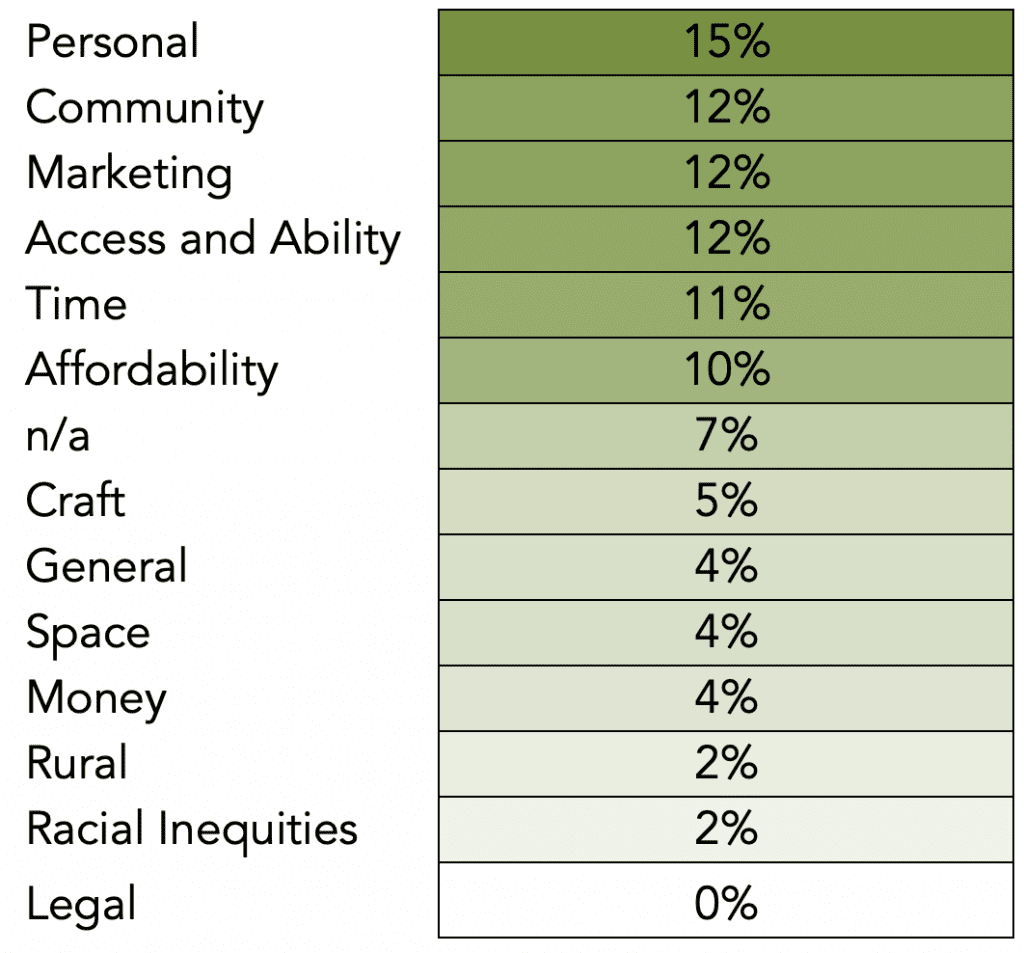
What challenges do you face as an artist in Washington State?
The biggest reported challenges responding artists in Washington face are around marketing and building an audience for their work, with 2/3 or more of all respondents ranking those concerns as Somewhat or Very Challenging.
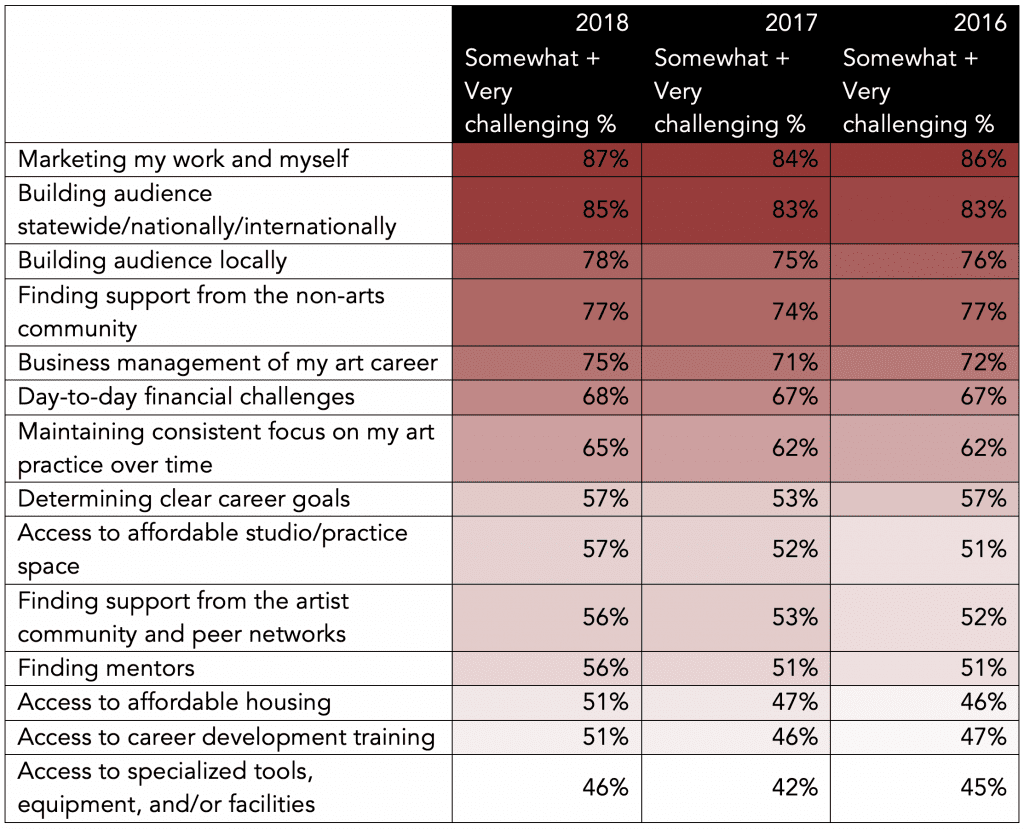
Overall, challenges artists faced are proportionally consistent since last year’s data was collected, with respondents expressing high concern on issues regarding marketing, promotion, and building audience.
The biggest shift is urgency: 2018 percentages across the board shifted upward, anywhere from 1% to 5% higher than in 2017.
Again this year, we included a write-in option to this question, allowing respondents to share off-menu challenges they are currently facing in their professional practices. This write-in data, although challenging to analyze, provides a bigger picture of the state of responding artists and allows issues to come to light that we may not be fully aware of.
This year, we categorized the open-response data and added tags to associated answers. The percentage breakdown of write-in answers is outlined in the following table, but primarily centers personal challenges and issues related to respondents’ communities.
How interested are you in receiving business practice trainings/resources for artists in the following ways?
Responding artists are interested in both online resources and in-person workshops, with each receiving 59% positive responses in 2018.
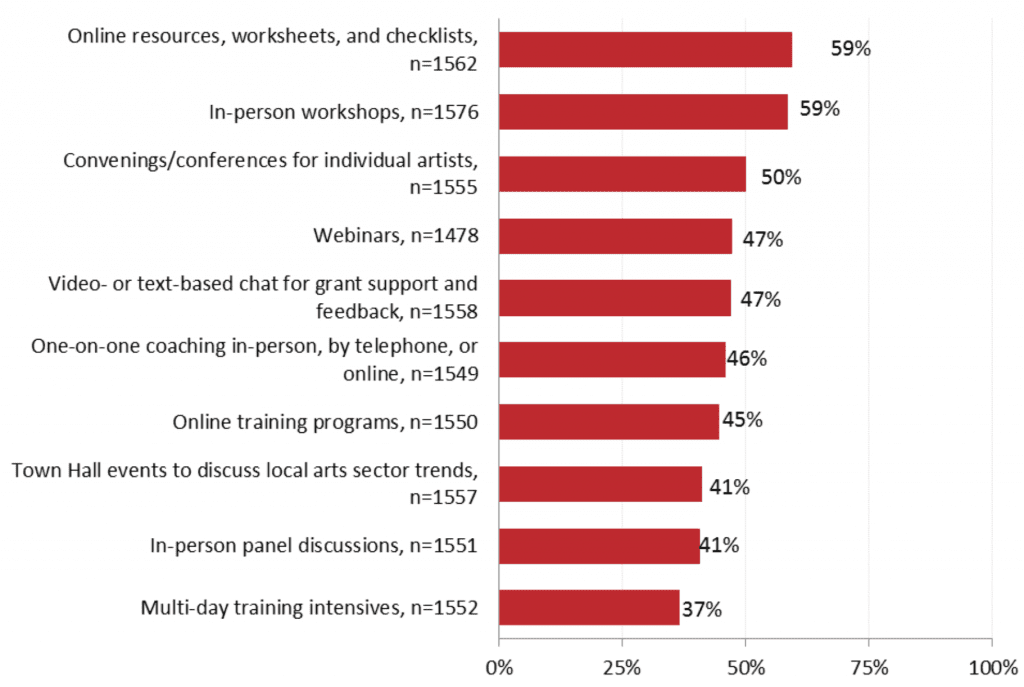
The continued interest in online resources, training programs, and individualized support is important as we move forward with a website relaunch that emphasizes online program delivery. Additionally, these results continue to highlight the value of in-person opportunities to connect with other artists through workshops, convening, and other educational networking opportunities.
Do you feel like artists are supported where you live?
55% of responding artists feel as though artists are “Somewhat” supported where they live.
| Yes | 25% |
| No | 13% |
| Somewhat | 55% |
| I’m not sure | 6% |
This question intended to get at the root of our work: supporting artists. The chosen responses indicated that most artists feel that artists are somewhat supported where they live, which speaks to the nuance involved in artist support. On either side, we see that 25% of artists firmly believe that artists are supported where they live, while 13% disagree.
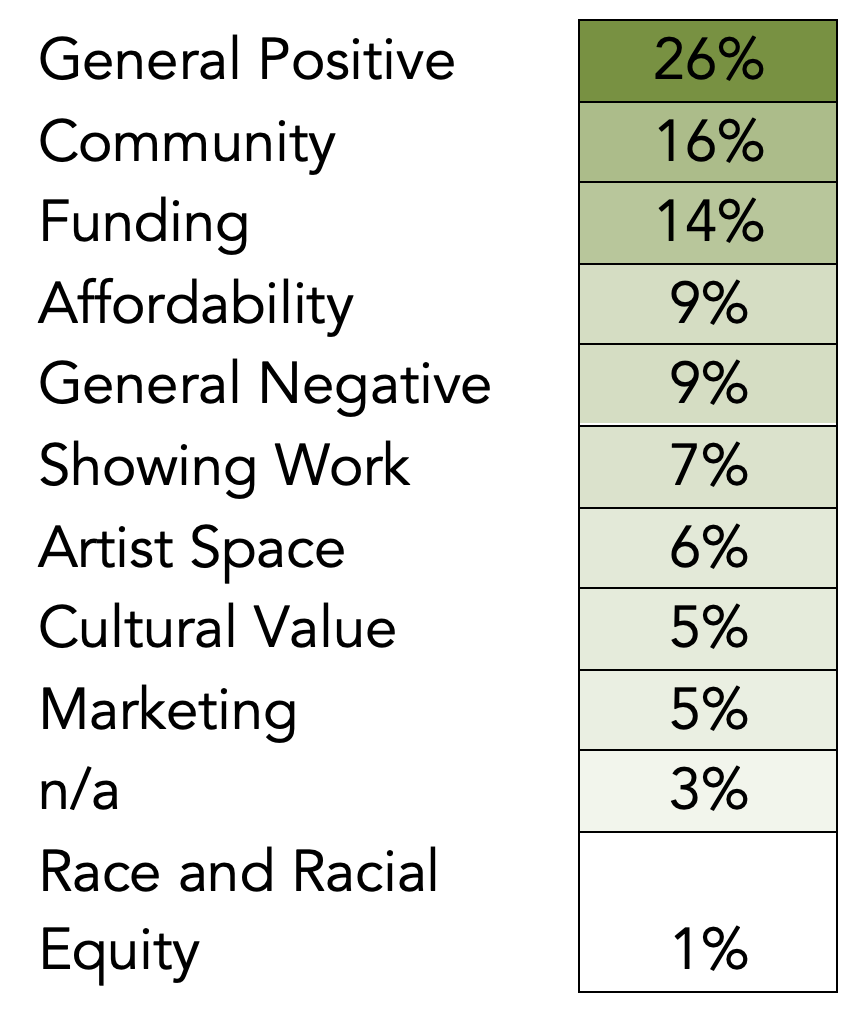
In addition to the radio selection for this question, we also invited artists to share their responses to the open-field question “Please explain the types of support that currently exist where you live and other types of support you need.” We categorized these open responses, and found that much of the feedback was positive. The places where responding artists noted additional support need included community support, funding, and affordability.
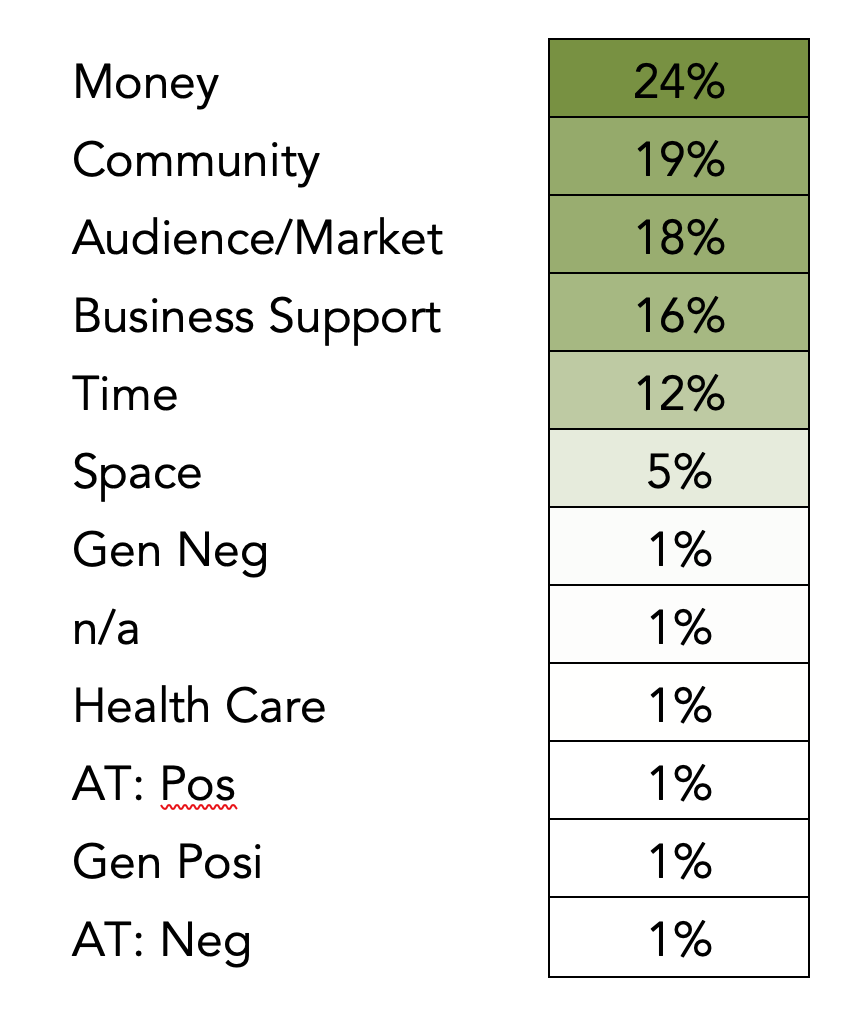
Artist Trust provides direct support to artists, creates connections between artists and their communities, and makes visible issues impacting the livelihoods of working artists. Our goal is to help artists thrive. What do you need to thrive as an artist?
With this question, we intended to understand the many types of support artists need to thrive, not just survive, as artists. The responses were rich, highlighting many underresourced areas of support and opportunities for organizations like Artist Trust, OLY ARTS and the community at large to step in to support artists. Above all, artists identify money as the most necessary component of thriving, followed by community and audience/market.
Conclusion
The 2018 Annual Artist Survey provides information that will continue to inform our programming and artist support at Artist Trust and OLY ARTS.
We make the results and this report available publicly with the hope that other artist-serving organizations, and even artists, can look to this data to understand Washington State’s artists and better meet their needs.
Please contact Artist Trust with any questions about this report or for access to full data from the survey: 206-467-8734 / artisttrust.org.